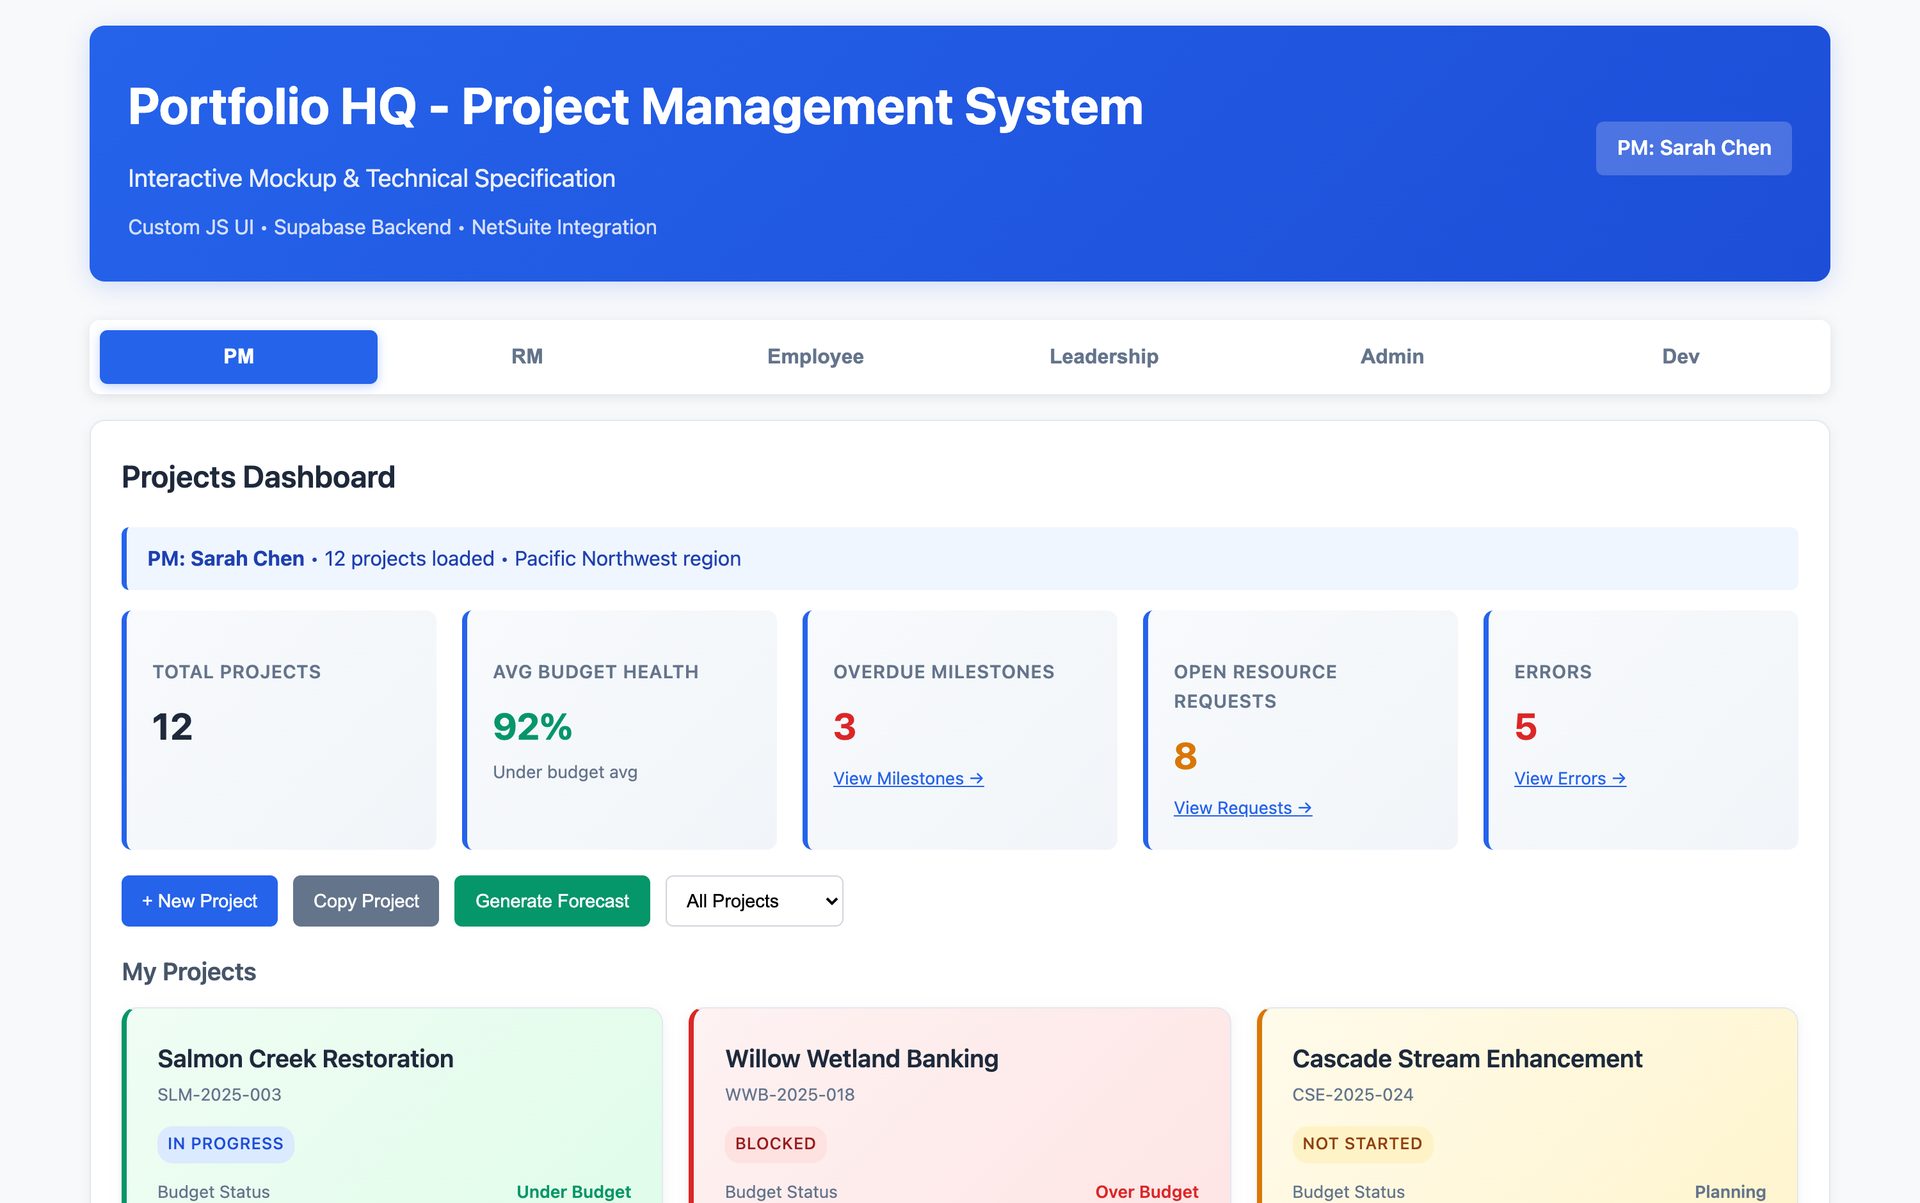
A company that restores rivers, wetlands and habitat at national scale, assembled from nine acquisitions in eight years. Its financial system of record held the truth about every project and was not somewhere a project manager could work. So the actual planning happened in spreadsheets beside it, and the gap between the two was found at month end, by somebody reconciling by hand.
The project and manager counts are the client's own, established during the engagement and revised upward from an initial estimate. The acquisition count is from the company's own published announcements, 2014 to 2022, none of which disclosed terms. Their own site describes them as the largest dedicated provider of nature-based solutions in the United States; that is their description of themselves and no independent body has certified it.
A working surface between the people running projects and the system that holds the money. The financial system stays the system of record. Project managers plan, assign and report in something built for them, and every change travels back through an accounting approval before it is allowed to alter the record.
The work breakdown mirrors the financial system three levels deep, with the top two levels locked so the connection cannot be broken by somebody renaming a task. The connector itself uses OAuth 1.0, an authentication method the platform does not support as standard, so it needed the vendor's own approval to exist at all.
Every row stores a snapshot of its own last synced state. That is what lets the screen show a project manager exactly where their edits have diverged from the record, in five distinct states, rather than the usual choice between silently overwriting and refusing to save.
Around that: resource requests that become real assignments with a capacity warning when somebody is over-allocated, an employee view with a weekly schedule and an hours adjustment that routes to the project manager for approval, a leadership view with project health by region and a sixty day cash collection forecast, and a two-step wizard for copying a project that lets cost and duration scale independently.
This entry is here for the part that went wrong. The design was sound, the platform could not carry it, and finding that out early is most of what the engagement was worth.
| Holds | Estimated |
|---|---|
| Projects | ~2,500 |
| Cost items per project | ~23 |
| Assignments | several per cost item |
| Where | One table |
One place for every project, every cost item and every assignment, which is the obvious design and the right one at the size everybody believed the portfolio was.
The estimate going in was about two and a half thousand active projects.
Roughly six thousand live projects, not two and a half thousand. Run through the cost items and the assignments hanging off each one, that projected to between twenty and forty million rows.
The client's own analysis was the thing that produced it, and it also corrected a fear in the other direction: about three hundred and forty thousand tasks, far fewer than the two and a half million people had been bracing for.
  transmitted per sync    10,000 rows      <- hard ceiling
  usable per document    100,000 rows      <- degrades above

  projected             20,000,000 rows    to
                        40,000,000 rows

// Two orders of magnitude. Not a tuning problem.Two hard numbers came out of testing: a ten thousand row ceiling on what a synced table will transmit, and performance falling away above a hundred thousand rows in a document.
Neither is a number anybody had written down. They were found by building against them.
Rather than guess, we took it to the platform's own developer relations lead. The answer was that the rate limits are undocumented and variable, and that this is not what the product is for.
That call is the single most valuable hour of the engagement. It turned an argument about optimisation into a decision about architecture.
| What | Result |
|---|---|
| Documents generated in one run | 1,200 |
| API calls it produced | 11,000 |
| Outcome | Cascading rate limits |
| Where it happened | In a test |
Twelve hundred documents were generated in one run to see what would happen. It produced eleven thousand API calls and cascading rate limits.
Failing in a test costs a morning. Failing after handover, with project managers relying on it at month end, costs the client their confidence in the whole thing.
One document per project manager, around fifteen projects each, with a real database underneath rather than the platform's own storage.
The generation that had failed at twelve hundred then ran at scale: one thousand four hundred and nine project documents produced from a single template, almost all of them on one day.
The system was cut back to a first release at the end of the engagement, with a set of features deliberately deferred rather than half built. What shipped is the part that changes somebody's day: a project manager plans where they work, accounting approves before anything touches the record, and the screen shows where the two disagree before month end rather than during it.
The document count was measured by surveying the live workspace and is 89% of everything in it. The rest is counted from the delivered system and from the engagement's own records. The portfolio and manager counts are the client's own figures, which is why they sit in the band above rather than here.
This page once carried claims that described the work inaccurately. They came down in an audit of our own copy, and each one went back up only when its numbers could be traced to something measured. A case study you cannot check is worth nothing to you, and one that turns out to be wrong costs us more than it ever earned.